Sigma Learning Hub
Practical data skills,taught so you can actually defend it
Statistics, research methods and the analysis tools that sit beside them — taught with the dataset in front of you, the assumptions checked, and the result written up the way a journal wants to read it. SPSS & Statistics, Research Methods and Python & Data Analysis open now; Excel, SQL and Power BI being built on the same method.
14
courses to enrol in
100
modules ready now
133h 35m
of learning time
3
subject areas open
Explore by area
Six subjects, one method
Every area is taught the same way — a real dataset, the software path in full, and the sentence that reports the result. Three are open today; the rest are being built in the same shape.
Excel
Formulas, lookups, pivot tables and dashboards, for data that arrives messy and lives in a spreadsheet.
On the roadmap
SQL
Query, join and aggregate a real database yourself instead of waiting on an export from somebody else.
On the roadmap
Power BI
Models, measures and dashboards a decision-maker can read at a glance — and trust enough to act on.
On the roadmap
Featured
Where most people start
The broadest enrolment we offer, and the two tracks most people open first.
 Most complete
SPSS & Research Methods Professional Certificate
Every track, start to finish — from your first research question to defending your results.
The catalogue
Courses you can enrol in today
Buy a track for one job of work, or the whole curriculum at once. Modules you finish carry across if you upgrade later.
13 courses · Clear filters
Only need one test? Every module can be bought on its own from the curriculum map.
Learning paths
Guided routes, beginner to advanced
Courses in the order that makes each one easier than the last. Take a path stage by stage, or jump in wherever your work already is.
SPSS & Statistics Path
From your first research question to a results chapter you can defend.
For: Postgraduate researchers, clinicians, and anyone whose data lands in SPSS.
- 1Beginner
Research foundations
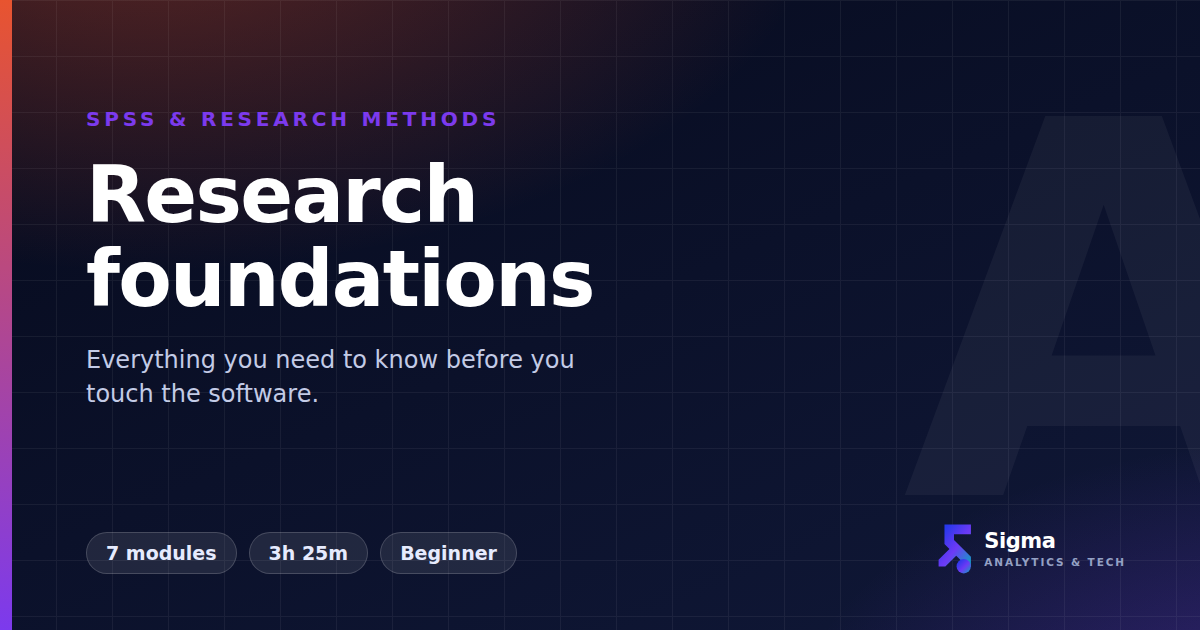
Design, sampling, measurement and reliability — the decisions that make an analysis possible at all.
Free· 7 modules
- 2Beginner
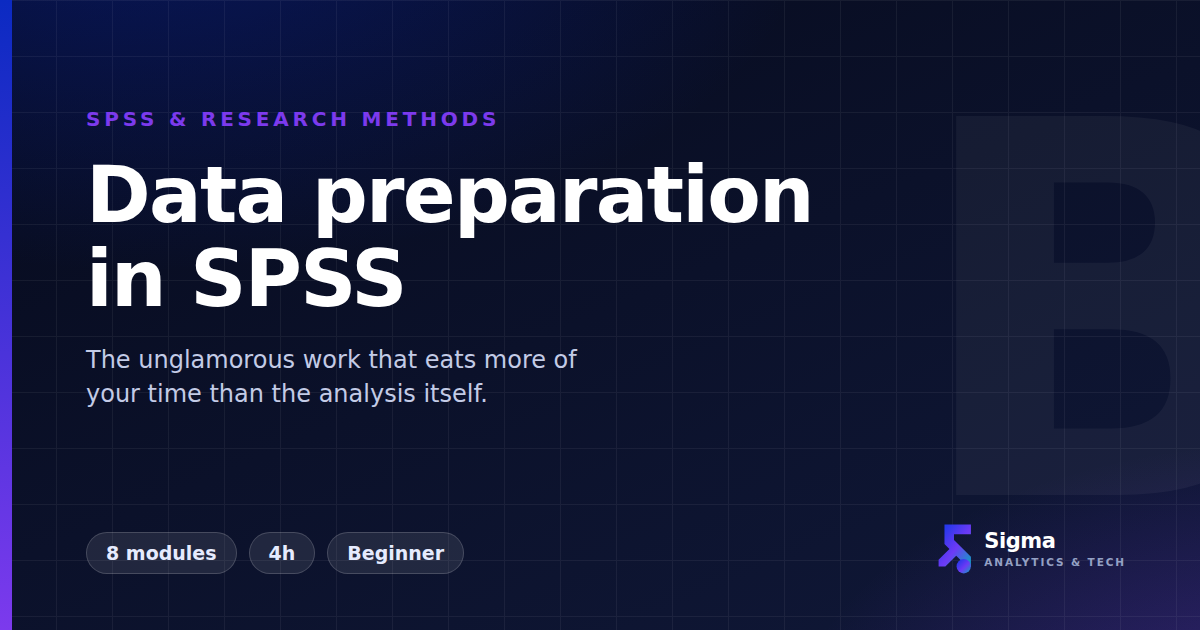
Data preparation in SPSS
Coding a questionnaire, handling missing data, and writing syntax you can run again next month.
Free· 8 modules
- 3Beginner
Describing data
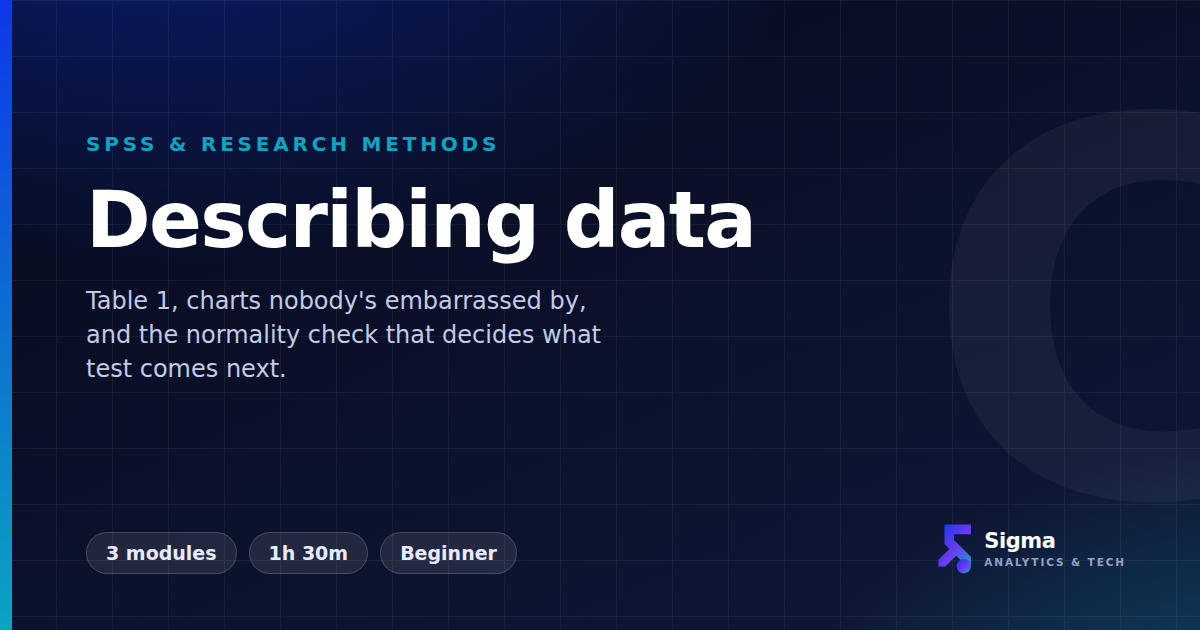
Table 1, charts nobody is embarrassed by, and the normality check that decides your next test.
₦10,000· 3 modules
- 4Intermediate
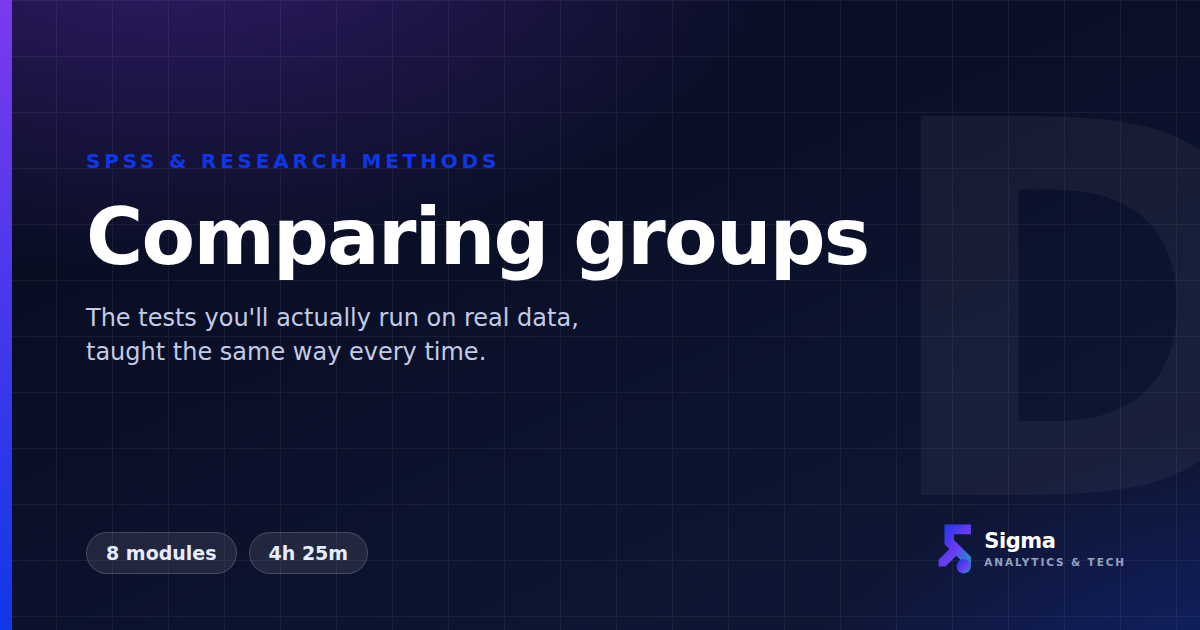
Comparing groups
Chi-square, every t-test, ANOVA through ANCOVA — and the non-parametric answer when an assumption fails.
₦25,000· 8 modules
- 5Intermediate
Relationships and prediction
Correlation through multiple and logistic regression, with moderation and mediation in PROCESS.
₦25,000· 6 modules
- 6Advanced
Scales and multivariate
Scale reliability, factor analysis, MANOVA and cluster analysis.
In production
Ends with: SPSS & Research Methods Professional Certificate
Take the whole path in one courseData Analyst Path
Take a raw table and turn it into a finding somebody can act on.
For: Analysts, M&E officers, and anyone who reports numbers to a decision-maker.
- 1Beginner
Describing data
Summarise, visualise and sanity-check a dataset before anyone draws a conclusion from it.
₦10,000· 3 modules
- 2Beginner
Excel for analysts
Lookups, pivot tables and clean workbooks — the tool most data actually arrives in.
In production
- 3Intermediate
SQL for analysts
Query and join a live database instead of waiting for somebody to send you an export.
In production
- 4Intermediate
Comparing groups
Test whether the difference in front of you is real, and report it so it holds up.
₦25,000· 8 modules
- 5Advanced
Power BI dashboards
Turn the model into something a decision-maker reads at a glance and trusts enough to act on.
In production
Python Data Analysis Path
The same analysis, in code that re-runs itself when the data changes.
For: Researchers and analysts who have outgrown point-and-click.
- 1Beginner
Python foundations
Enough of the language to be useful in a week: types, loops, functions and notebooks.
In production
- 2Beginner
pandas and data wrangling
Loading, cleaning, reshaping and merging data that was never tidy to begin with.
In production
- 3Intermediate
Statistics in Python
The tests from the SPSS curriculum, run again with scipy and statsmodels.
In production
- 4Advanced
Visualisation and reporting
Charts that survive a reviewer, in a notebook that reproduces its own results.
In production
Inside the curriculum
Every module we teach, and what is in it
The teaching behind the courses above, grouped the way it is taught. Take one module on its own, a track at a time, or the whole subject.
SPSS & Research Methods
SPSSResearch statistics taught the way they are actually used — the assumption that chooses the test, the SPSS path in full, and the sentence that reports it.
Tracks
Research foundations
Data preparation in SPSS
Describing data
Comparing groups
Relationships and prediction
Scales and multivariate
Specialist methods
Reporting and defence
Available now
See all 44 →Python for Data Analysis
PythonFrom no Python at all to six finished analyses — the language, NumPy, pandas, the charts, the statistics, and the models, each taught in a notebook you run yourself.
Tracks
Python foundations
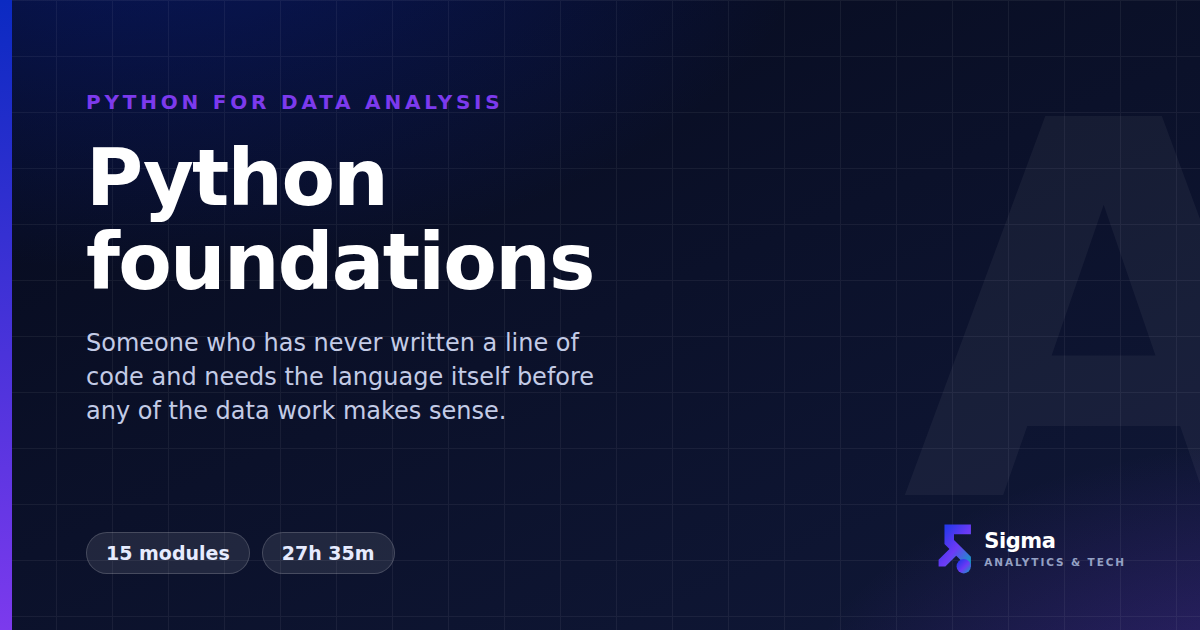
Someone who has never written a line of code and needs the language itself before any of the data work makes sense.
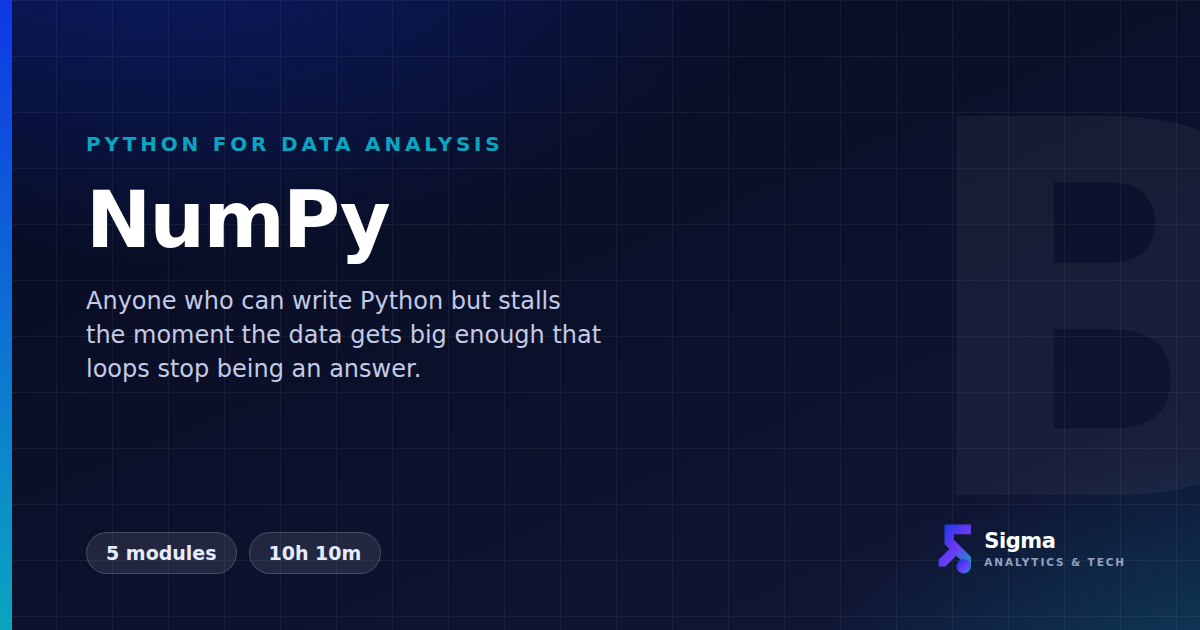
NumPy
Anyone who can write Python but stalls the moment the data gets big enough that loops stop being an answer.
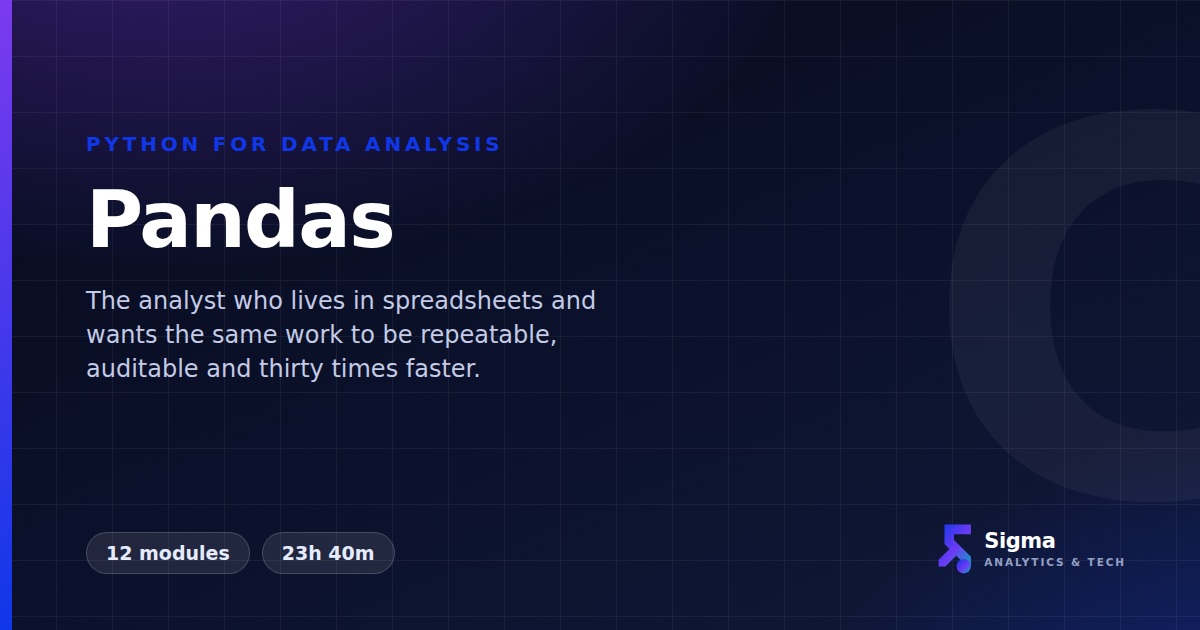
Pandas
The analyst who lives in spreadsheets and wants the same work to be repeatable, auditable and thirty times faster.
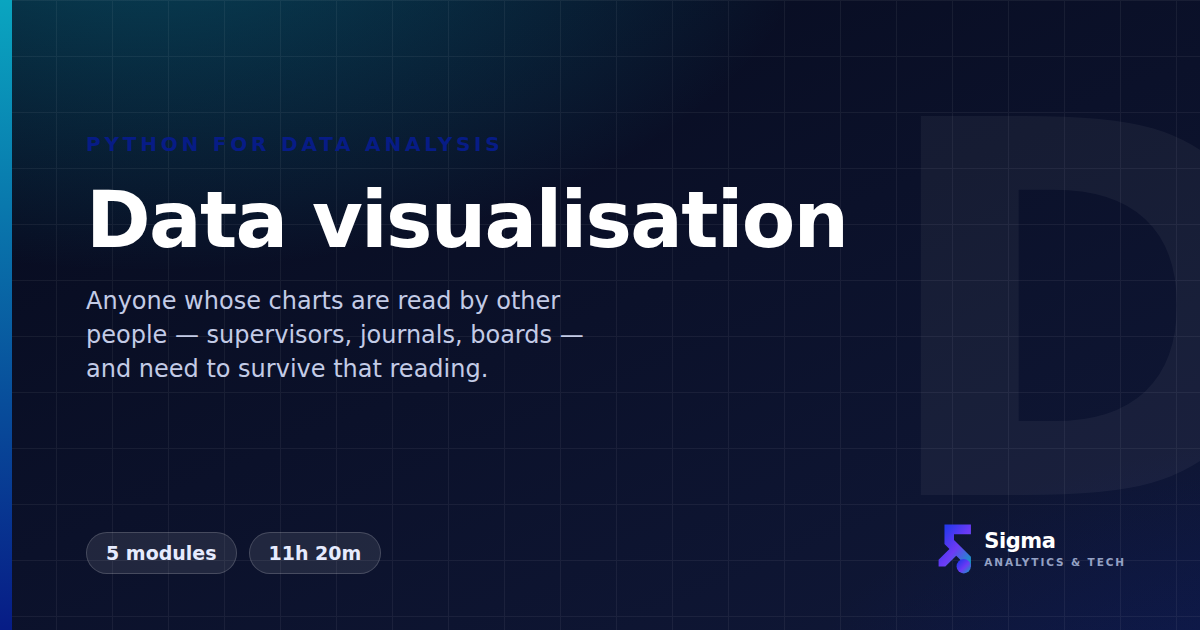
Data visualisation
Anyone whose charts are read by other people — supervisors, journals, boards — and need to survive that reading.
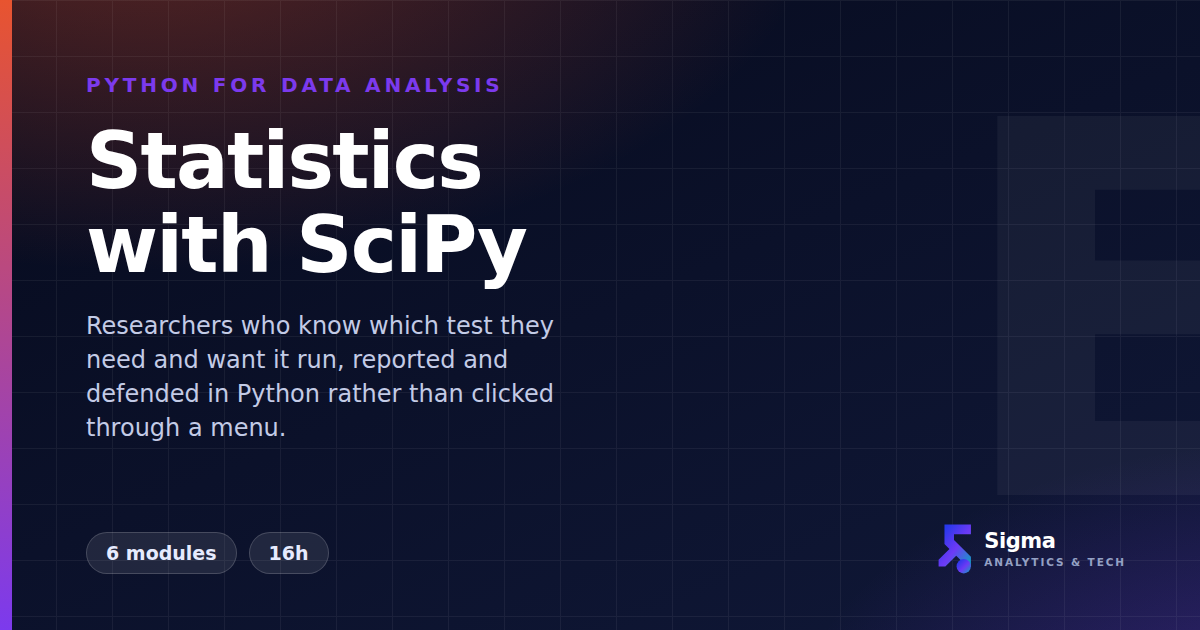
Statistics with SciPy
Researchers who know which test they need and want it run, reported and defended in Python rather than clicked through a menu.
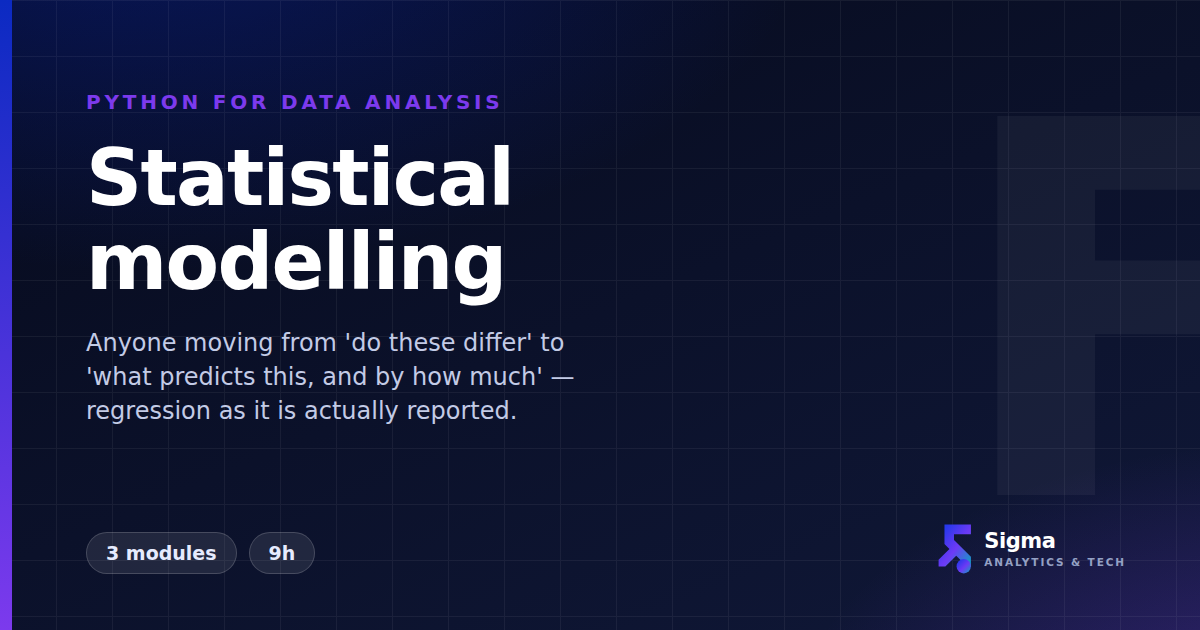
Statistical modelling
Anyone moving from 'do these differ' to 'what predicts this, and by how much' — regression as it is actually reported.
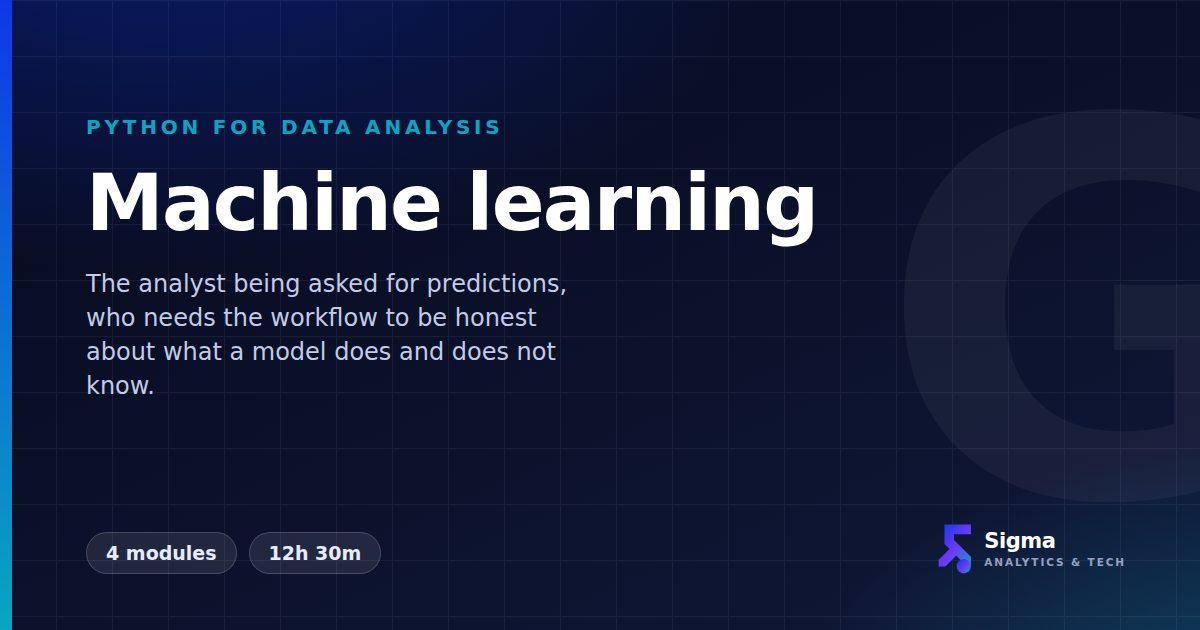
Machine learning
The analyst being asked for predictions, who needs the workflow to be honest about what a model does and does not know.
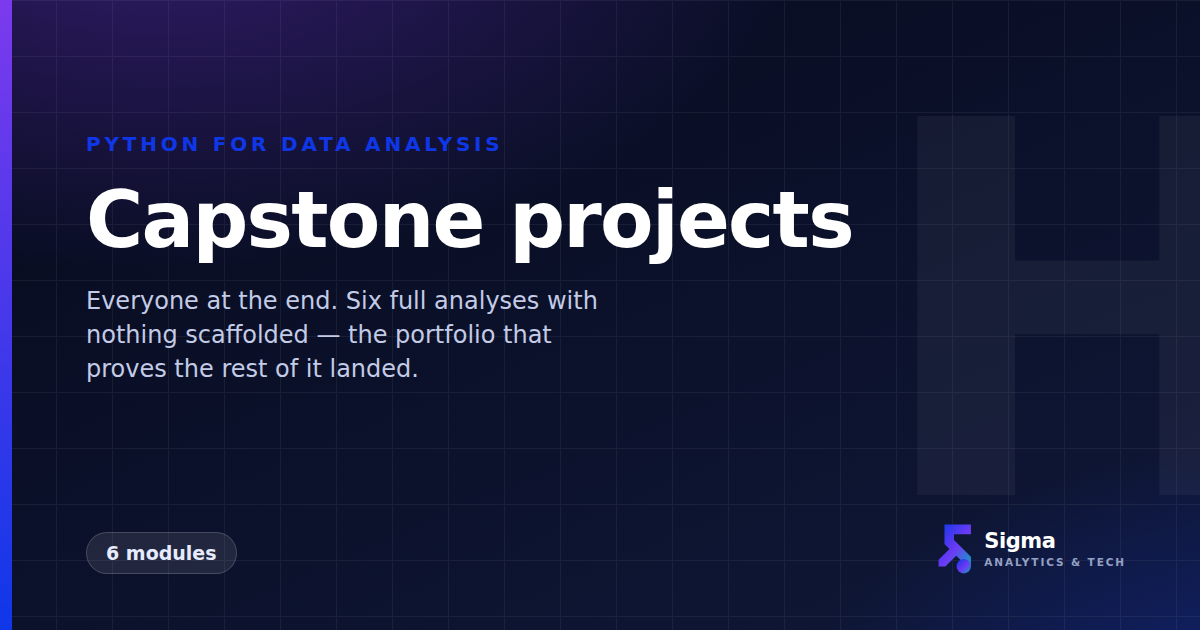
Capstone projects
Everyone at the end. Six full analyses with nothing scaffolded — the portfolio that proves the rest of it landed.
Available now
See all 56 →Coming soon
What we are building next
Each one is being written the same way as the SPSS curriculum — a real dataset, the full path through the software, and the output you should expect to see.
- SQLQuerying and joining real databases
- ExcelLookups, pivots and clean workbooks
- Power BIModels, measures and dashboards
- RThe same statistics, in tidyverse
Want one of these sooner? Tell us which and we’ll build it first.
What's included
Every module comes with
- Lifetime access — revisit any module, any time
- The dataset, the syntax file and the codebook for every module
- Worked examples with the output you should expect to see
- Certificate of completion for your CV and LinkedIn
- Learn on a laptop or a phone, with your progress saved
How it works
From enrolment to certificate
- 1
Pick what you need
Take a whole programme, or a single module if you only need one test. Not sure? Message us your research question and we'll point you at the shortest path.
- 2
Enrol and start
Pay online and your access is live immediately. No waiting for a reply, no scheduled start date.
- 3
Work along with the data
Every module ships with the dataset it teaches from, so you run the analysis yourself rather than watching someone else run it.
- 4
Earn your certificate
Finish the modules and your certificate is issued automatically, with a code that verifies it.
Training a team?
Discounted bundles for groups and corporate licences with progress reporting. Tell us your team size and we’ll send a proposal within one business day.
Request a proposal →Looking for the SPSS Data Analysis Course?
That one is delivered jointly with Souverain Statistics and lives on the partnership site, not here.
Go to the partnership site →FAQ
Course questions, answered
Do I need any experience to join a training or course?
No. Our beginner tracks assume zero prior experience — we start from the basics and build up with practical exercises. Intermediate courses list their prerequisites clearly, and we'll advise you on the right starting point if you're unsure.
Will I get a certificate?
Yes. Every completed course and live training comes with a certificate you can add to your CV and LinkedIn profile. At the end of your programme we share an access code — use it on our certificate page to download your certificate instantly.
How do I pay for a course or training?
Every course and cohort has a secure Paystack checkout — pay online with card, bank transfer or USSD and your spot is confirmed instantly. Prefer to talk first, or need corporate invoicing for your organisation? Message us and we'll sort you out.
What happens after I send an enquiry?
We respond within one business day (usually much faster on WhatsApp). We'll ask a few questions about your goals, then recommend the right course, cohort or engagement — no pressure, no obligation.
Not sure where to start?
Tell us your research question, your data or the job you need to do, and we'll tell you which path fits — and the shortest way through it.